¶ Multidimensional analysis
The Multidimensional analysis view enables you to analyze web requests of your services with fine-tuned filtering, so you can focus your analysis on the dimensions that matter most. This view is easily configurable and serves as a convenient entry point for in-depth analysis of your services.
With multidimensional analysis, you can investigate custom views: Top web requests, Database statements, and Exception analysis.
To access the Multidimensional analysis page
- Go to Multidimensional Analysis.
- Choose one of the analysis options that you want to investigate, or Create analysis view
¶ Pre-defined views
¶ Top database statements
Analyze the most frequent and most expensive database statements.
Go to page →¶ Data source
Multidimensional analysis uses trace and request data as its data source, which includes information on distributed traces and requests.
-
For timeframes shorter than two hours, a higher resolution (below 1 minute) is used.
-
For larger amounts of data, especially for longer timeframes or unfiltered analysis, sampling is applied: only a fraction of trace and request data is used.
-
To view the information about the data used for analysis and suggestions on how to improve accuracy, hover over Refine.
-
To include more data to the analysis, select Refine.
¶ Multidimensional analysis vs charts
Unlike Data Explorer, multidimensional analysis uses trace and request data, not metric data, so values on multidimensional analysis charts might differ from values on custom charts.
¶ Configure view
In Configure view, you can set up multiple filtering capabilities. The view updates automatically as you change the parameters.
| Parameter | Description |
|---|---|
| Metric | The metric to be analyzed. |
| Aggregation | How the metric values are aggregated. Available aggregations depend on the selected metric. |
| Split mode | How dimensions specified in Split by dimension are treated. • Split by services — each dimension is displayed separately for each service. • Merge by services — same dimensions from different services are merged into one. |
| Split by dimension | A list of dimensions by which the requests are split. You can specify several dimensions. Place your cursor in the input field to see the available options. The requests are split by dimension in the specified order. |
| Filter requests | Filter the requests to be included to the view. Place your cursor in the input field to see the available options. Criteria of the same type are grouped by OR logic. Criteria of different types are grouped by AND logic. |
You can export the table data in a comma-separated values (CSV) file.
-
In the lower-right corner of the page, select Show export menu More.
-
Select Export visible data or Export table data.
| Option | Exported data | Fields | Number of entries |
|---|---|---|---|
| Export visible data | The currently displayed area of the table, taking into account applied filters | Only visible data | Up to 100 top dimensions |
| Export table data | All table data | All the available data related to top dimensions | Up to 100 top dimensions |
¶ View
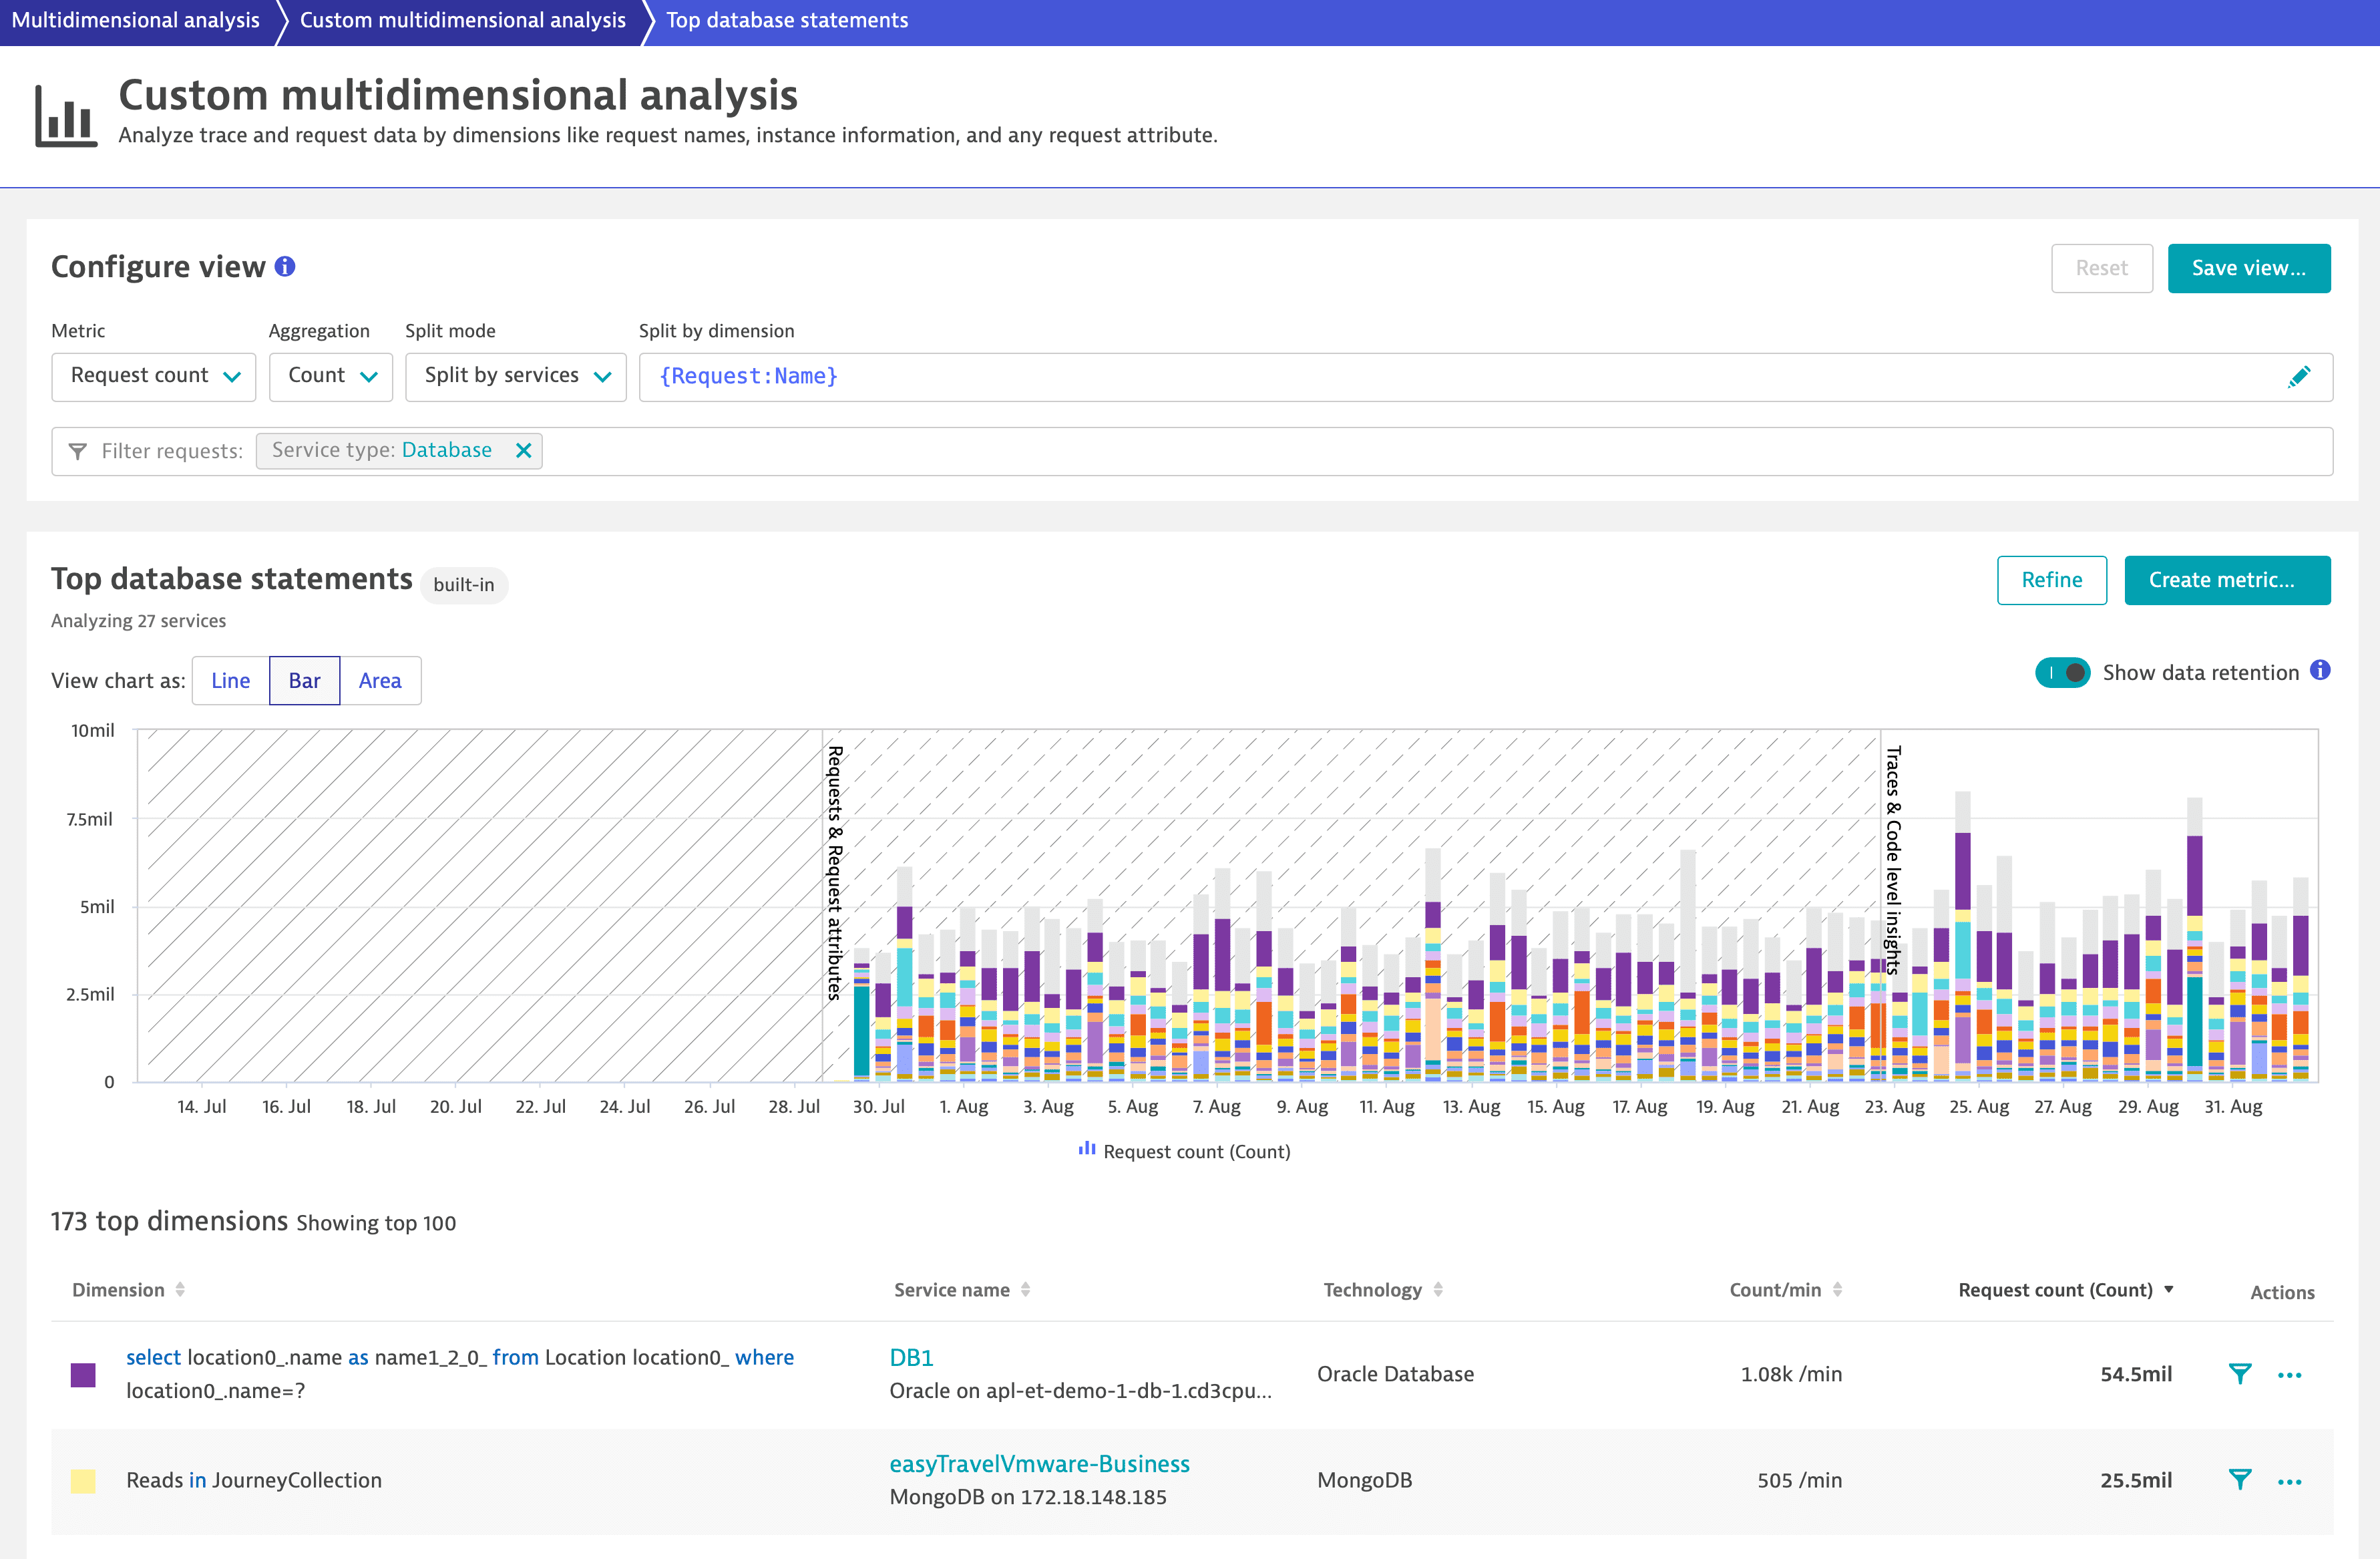
The chart shows the top 15 dimensions (all other dimensions are aggregated into a single dimension) and the table beneath contains up to 85 more dimensions, bringing the total number of chartable dimensions to 100. The view instantly adapts to the changes you make in the Configure view pane.
In the Actions column of the table, you can select:
- Filter to filter the view for the specified dimension.
- More (…) to access further analysis options from the Analyze menu.
For timeframes containing data older than 10 days, you can turn on Show data retention to better understand which data is available for which period directly from the chart.
¶ Save view
Once the view is configured, you can save it for quick access in the future. Just select Save view and provide a name.
DESK provides several views out of the box:
¶ Calculated service metric
You can save the configured view as a calculated service metric, which you can use just like any other DESK metric, for example for charting or data export via API.
Only new data is written to calculated metrics; retrospective data is not included.
¶ Limits
- Only new data is written to calculated metrics; retrospective data is not included.
- You can have up to 500 enabled calculated metrics per environment and up to 100 enabled calculated metrics per service.
- Classic calculated metrics support at most 100 dimension values. This is referred to as the "top X" rule, as you can select fewer depending on your configuration. However you choose the top 100 dimension values, the remaining dimensions are aggregated into a single timeseries and the dimension value is accessible through a special remainder dimension. The remainder filter condition allowing you to filter on this remainder dimension.
To create a calculated service metric from a multidimensional analysis view
-
Go to Multidimensional Analysis.
-
Select Create analysis view.
-
optional Select the management zone. The new metric will be restricted to data from this zone.
-
Configure the view. Find the description of available options in the Configure view section above.
-
In the View pane, select Create metric.
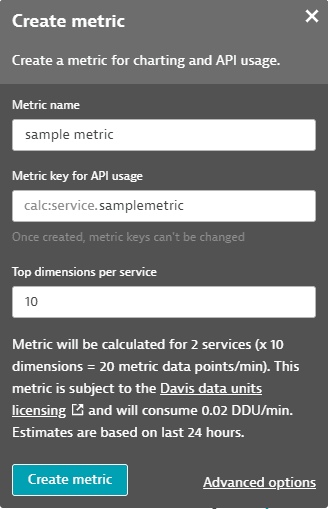
-
Specify the name for the metric. The name is added to the metric key automatically.
-
optional If needed, customize the metric key.
Once a metric is created, you can't change its key.
-
optional If you want to fine-tune your metric, select Advanced options to configure additional parameters of the metric. For details, see Calculated metrics for services.
-
Select Create metric.