¶ Oracle database insights
Early Adopter
Oracle database insights are going to be replaced with SQL data source-based extensions. For more information, see:
- Product news blog post: Intelligent observability for Oracle and SQL databases
- Oracle Database extension download in DESK Hub
- How to manage Oracle Database extensions
- How to extend Oracle SQL monitoring using Extensions 2.0 SQL data source
Database insights adds an infrastructure perspective to your database monitoring. With additional data fetched from the database layer, you're able to resolve performance problems that are rooted deep in the database, for example, understanding why a particular statement is slow.
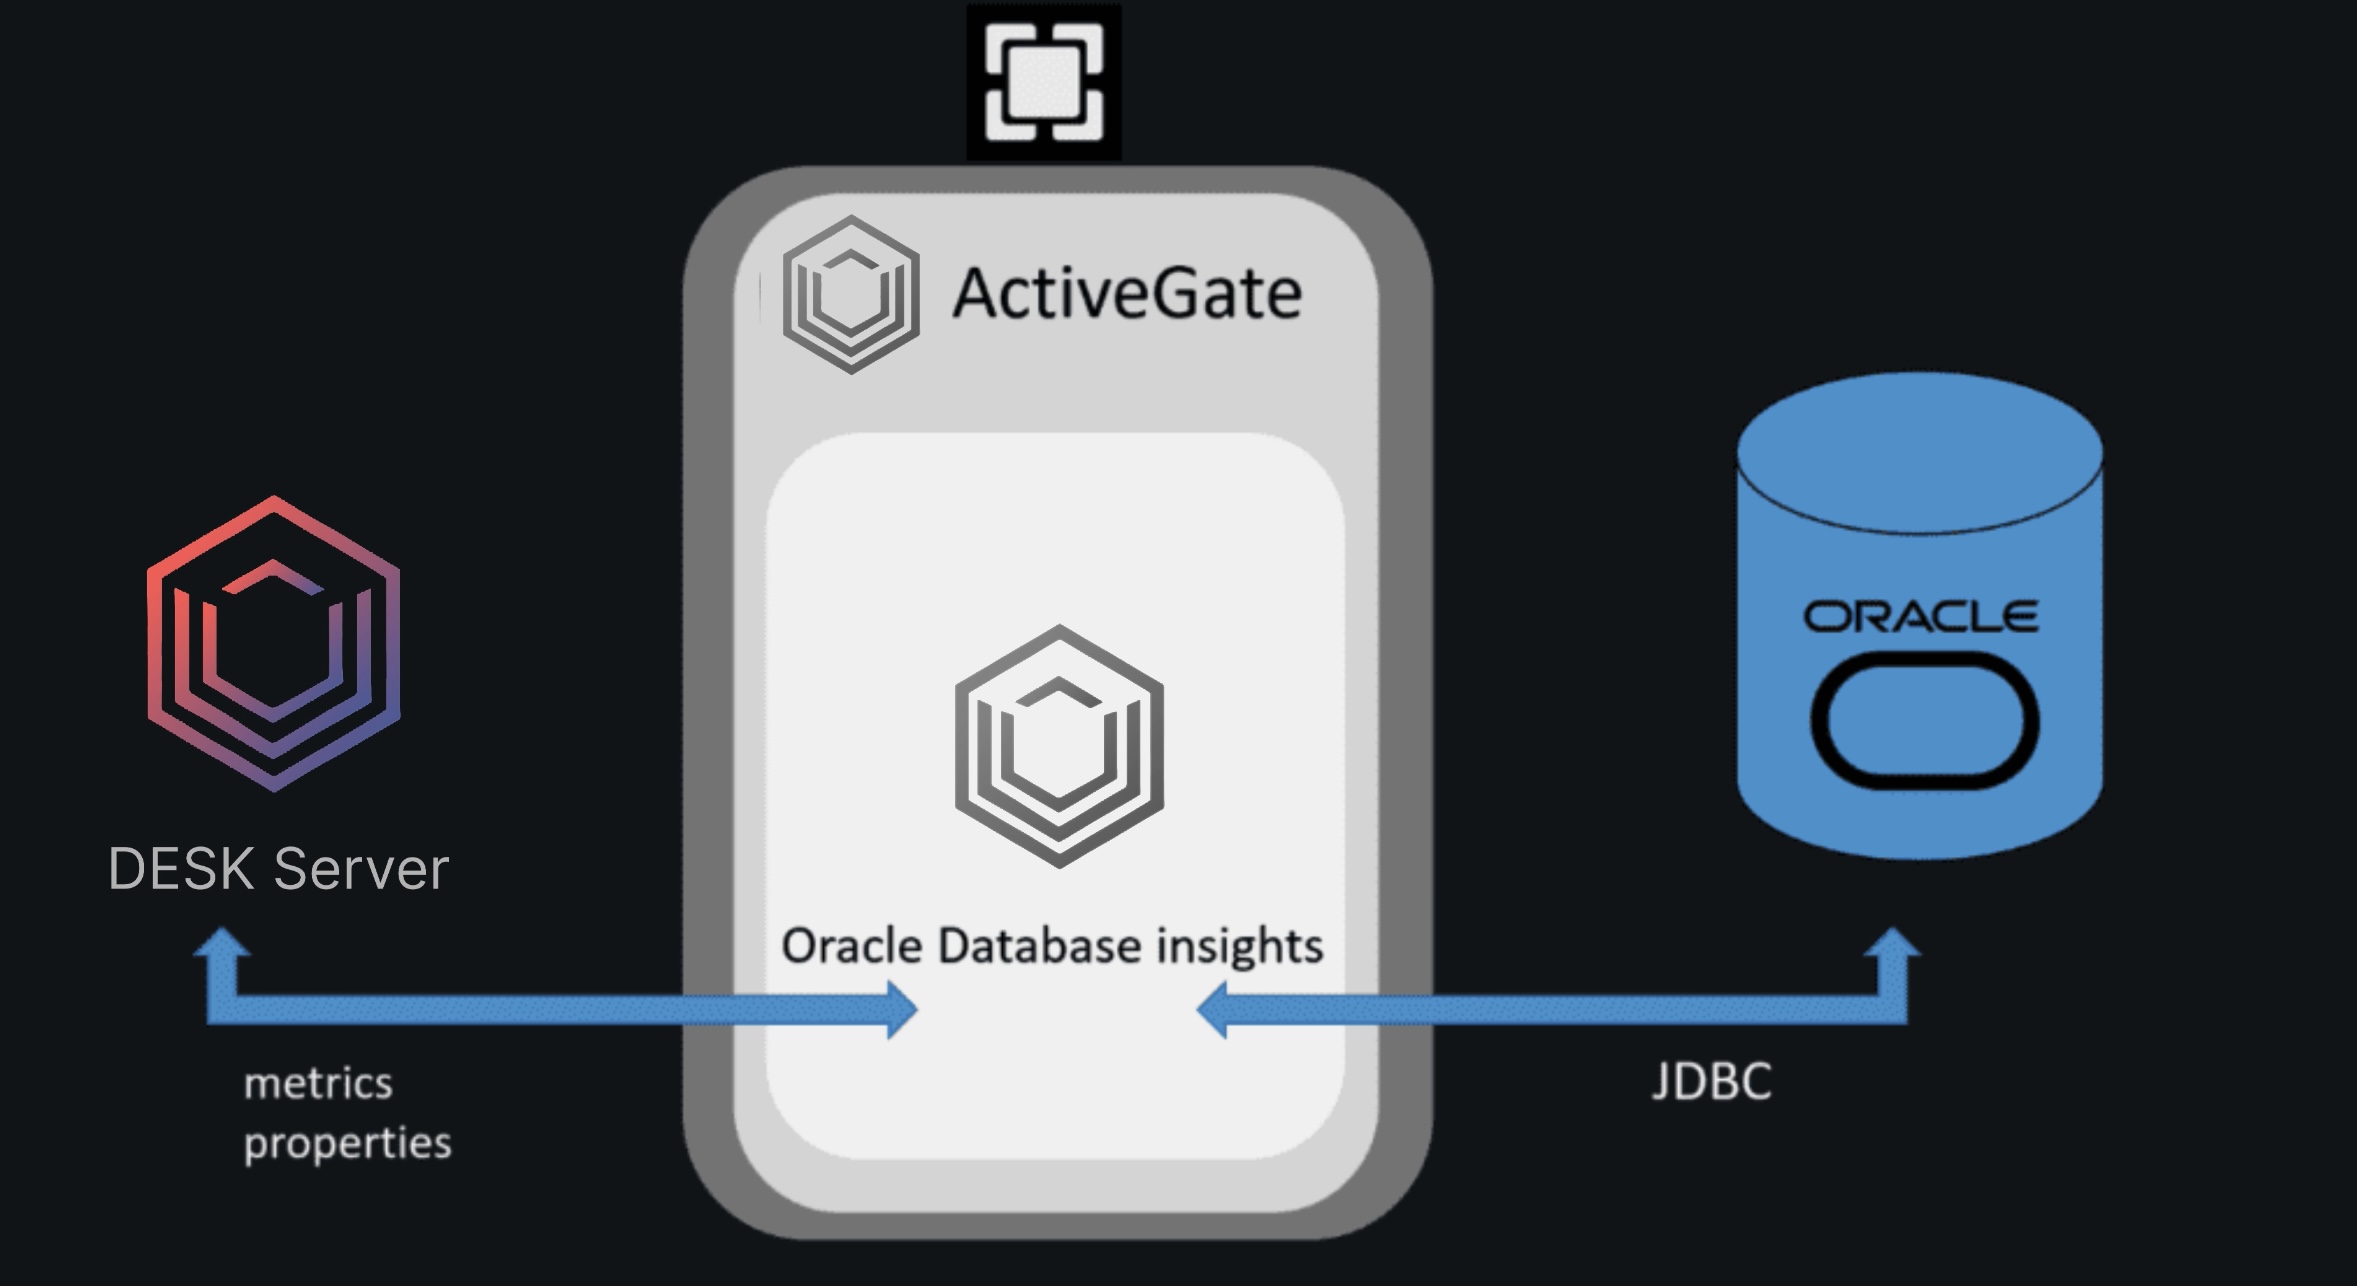
¶ How it works
Database insights runs on an Environment ActiveGate and connects remotely to Oracle databases. With this approach, the database system platform can be of any type—DESK supports all operating systems using the JDBC driver to connect to databases.
¶ Prerequisites
You need the following to start using database insights with your Oracle database:
You need the following to start using database insights with your Oracle database:
- Environment ActiveGate version 1.173+ installed in the default mode. Database insights doesn't support an ActiveGate that's configured for multi-environment support.
- Database insights requires 2.5 MB of RAM per Oracle database endpoint, which translates to a capability to monitor a few hundred databases with ActiveGate installed on the EC2 micro instance.
- DESK Server version 1.173+.
- Network communication between the ActiveGate and the Oracle Server.
- Oracle version 11g to 19c, including the support for:
- Oracle Multitenant
Monitoring results may vary between the SID-based and ServiceName-based endpoints. For SID-based endpoints, DESK monitors connections to the multitenant container database (CDB). For ServiceName-based endpoints, DESK monitors connections to associated pluggable databases (PDBs). - Oracle RAC
DESK monitors individual node instances (SIDs) only. You can't use database insights to monitor a cluster or to monitor individual nodes based on the database service that they're associated with. - AWS Oracle RDS
- Oracle Multitenant
- optional OneAgent installed on the Oracle host.
- An Oracle database user with the permissions listed below.
¶ Oracle permissions
You need to satisfy the following permissions on the Oracle server for Oracle database insights:
The user that connects to the DB instance needs to be granted the CREATE SESSION and SELECT_CATALOG_ROLE permissions. This also means the access to Dynamic Performance Views, which is a part of the SELECT_CATALOG_ROLE permission.
DBMS_XPLAN package with granted EXECUTE permission is required to fetch execution plans.
To create a user for Oracle database insights:
  CREATE USER oracleinsights IDENTIFIED BY password
  default tablespace users
 temporary tablespace temp;

 GRANT CREATE SESSION, SELECT_CATALOG_ROLE TO <oracleinsights>;
¶ Setting up Oracle database insights
Setting up Oracle database insights is straightforward. All you have to do is to define an endpoint—the Oracle database that the ActiveGate will connect to. You can add as many databases from a single Oracle server as necessary.
-
optional Install OneAgent on the Oracle host.
-
Select or install and Environment ActiveGate version 1.173+ that will fetch the data from your Oracle server. You can use this ActiveGate for other purposes as well.
Go to Settings > Deployment status to verify if your ActiveGate is up and running. Database insights is enabled by default. -
Go to Settings > Monitoring > Monitored Technologies.
-
Find the Database Insights: Oracle row and click the pen icon to edit it.
-
Define your Oracle database endpoint. All fields are mandatory:
- Oracle host
- Port: default =
1521 - Connection type:
ServiceorSID - Service/SID: database identifier
- Database user and Database password: For details, see the Oracle permissions section.
- Monitored database name: name of the database you want to monitor
-
Select the check box to accept the redistribution license agreement for the Oracle JDBC driver.
DESK uses this to fetch the data from your Oracle server. Your data is secure. -
Click Add database. If DESK can establish the connection using the details you've provided, it will start monitoring your Oracle database.
¶ Enabling and disabling Oracle database insights
To disable or enable Oracle database insights per monitored database
- Go to Settings > Monitoring > Monitored Technologies.
- Find the Database Insights: Oracle row and click the pen icon to edit it.
- Set the Monitoring off/on switch per database.
¶ Oracle database insights monitoring model
Installing OneAgent on the Oracle host is optional for database insights. Whether it is installed or not, all metrics are reported under Custom device to reflect the logical structure of your DB server instance, running services, containers, and plugged databases.
However, installing OneAgent on the Oracle host supplements the performance analysis of the server with all the OS process metrics reported to the process group and their instances split by the server instances (SIDs) and listener processes.
¶ Oracle database insights capabilities
¶ Most time-consuming Oracle statements
To understand and analyze which Oracle statements are the most expensive and most frequently called, click View statements in the Most time-consuming Oracle statements section. The page lists the 100 most time consuming statements. With a single click, you can see the statements that consume the most CPU, memory, or disk storage, or that generate the most wait time. You can customize your analysis using up to three metrics available for TopN analysis.
¶ Download execution plans
When analyzing the performance characteristics of a SQL statement, you often find yourself in need of generating and displaying the execution plan of the SQL statement. You can download the Oracle execution plan right from the DESK UI.
¶ Memory and cache metrics
Oracle database insights provide you with additional Oracle metrics related to memory and caches, which enables you to pinpoint the RAM-heavy statements.
¶ Data Explorer
All the Oracle metrics fetched by Oracle database insights are available for Data Explorer).
¶ Wait and tablespace metrics
You can also refer to the wait and tablespace metrics, which are available to be used in Data Explorer).
¶ Oracle process groups
DESK binds the data fetched by Oracle database insights with the Oracle processes detected by OneAgent. Starting with OneAgent version 1.173, each Oracle process group represents a single Oracle SID (unique identifier for every Oracle DB instance). The SID is part of the process group name and is extracted from process names (Unix) or service description (Windows). Oracle processes not associated with any SID form an Oracle other processes group. This includes the TNS Listener communication process, so all incoming and outgoing traffic is associated with the group.
Optionally, you can change Oracle database and listener process groups by splitting them by Oracle SID for databases or by name for listeners.
¶ Split process groups using Oracle SID
- Go to Settings > Processes and containers > Built-in detection rules.
- OneAgent version 1.231+ Select Group Oracle database processes by SID.
The Oracle database process group will be split into multiple process
groups with the name set to Oracle Database SID.
¶ Split process groups by Oracle listener
-
Go to Settings > Processes and containers > Built-in detection rules.
-
OneAgent version 1.243+ Select Group Oracle listener processes by name.
The Oracle listener process group will be split into multiple process groups with the name set to Oracle Listener listener-name.
¶ Metrics
This section describes Oracle database metrics accessible through DESK:
- Performance charts
- Time breakdown charts
- PGA memory charts
- SGA memory charts
- Most time consuming Oracle statements
- API-only metrics - These metrics are not charted in DESK but are accessible through the DESK API.
¶ Performance
Metrics concerning system performance.
¶ Example charts
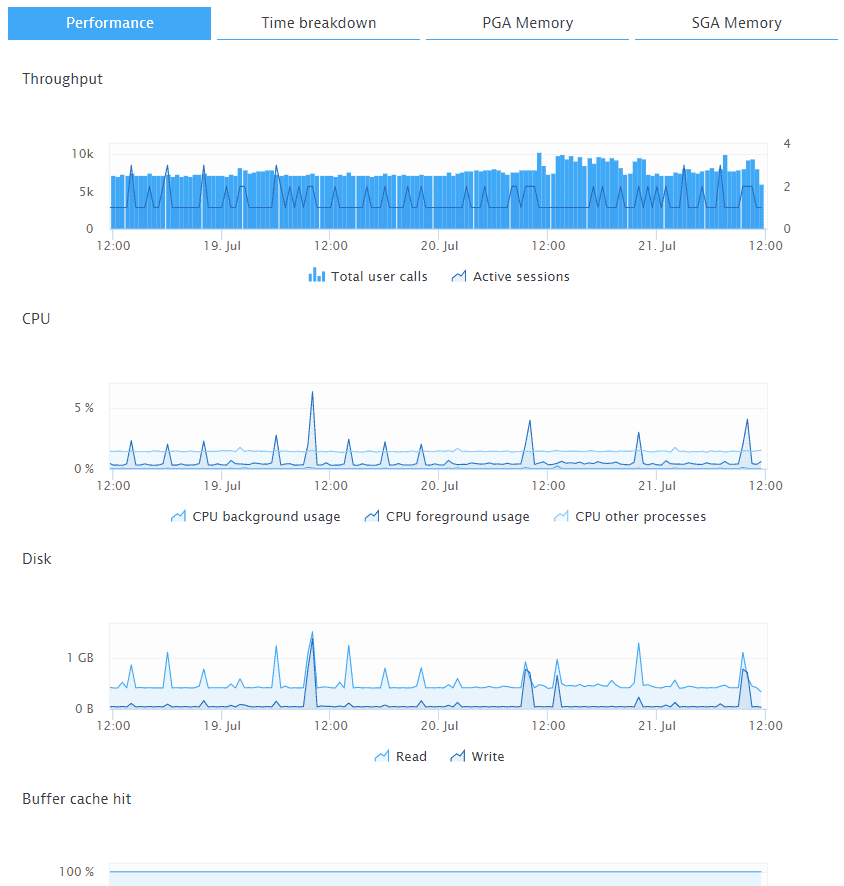
¶ Throughput
- Total user calls (count)
Total number of logins, parses, or execute calls.
Metric key: builtin:tech.oracleDb.cd.sessions.userCalls - Active sessions (count)
Total number of active sessions not assigned to Idle wait class.
Metric key: builtin:tech.oracleDb.cd.sessions.active
¶ CPU
- CPU background usage (%)
Average background CPU usage per CPU.
Metric key: builtin:tech.oracleDb.cd.cpu.background - CPU foreground usage (%)
Average foreground CPU usage per CPU.
Metric key: builtin:tech.oracleDb.cd.cpu.foreground - CPU other processes (%)
Average CPU usage of other processes per CPU (excluding foreground and background).
Metric key: builtin:tech.oracleDb.cd.cpu.other - CPU idle (%)
Average host CPU availability per CPU.
¶ Disk
- Read (B/min)
Total size in bytes of all disk reads for the database instance, including application reads, backup and recovery, and other utilities.
Metric key: builtin:tech.oracleDb.cd.io.bytesRead - Write (B/min)
Total size in bytes of all disk writes for the database instance, including application activity, backup and recovery, and other utilities.
Metric key: builtin:tech.oracleDb.cd.io.bytesWritten
¶ Table space
- Total space (B)
Total size of a tablespace.
Metric key: builtin:tech.oracleDb.cd.tablespaces.totalSpace - Used space (B)
Total amount of space used.
Metric key: builtin:tech.oracleDb.cd.tablespaces.usedSpace
¶ Buffer cache hit
- Buffer cache hit (%)
Represents the data block buffer cache efficiency, as the rate of the data blocks needed in memory.
Metric key: builtin:tech.oracleDb.cd.memory.bufferCacheHit
¶ Sorts in memory
- Sorts in memory (%)
Percentage of sorts (from ORDER BY clauses or index building) that are done in memory (as opposed to sorts on disk).
Metric key: builtin:tech.oracleDb.cd.memory.sortsInMemory
¶ Time breakdown
Metrics concerning time spent on various activities.
¶ Example charts
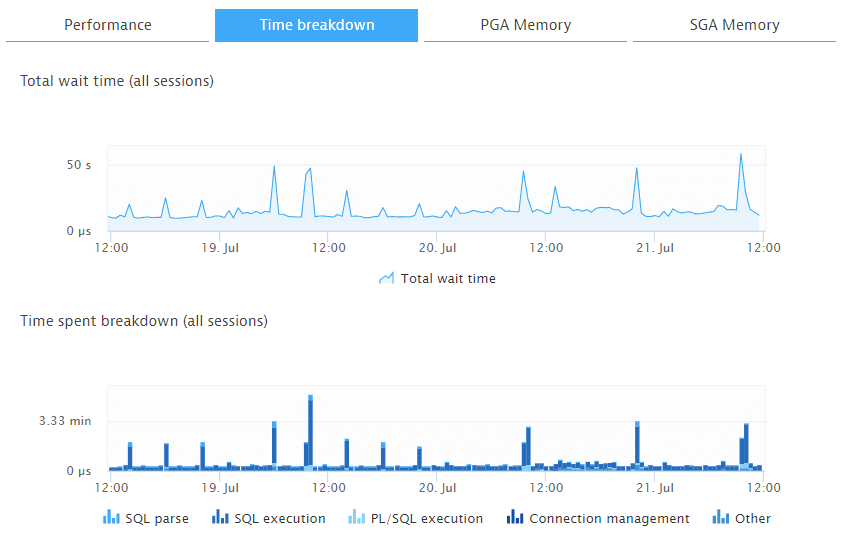
¶ Total wait time (all sessions)
-
Total wait time (μs/min)
Total time spent in all wait states except for Idle class.
Metric key: builtin:tech.oracleDb.cd.io.wait -
Time spent breakdown (all sessions)
-
SQL parse (μs/min)
Amount of time spent parsing SQL statements.
Metric key: builtin:tech.oracleDb.cd.queries.sqlParse -
SQL execution (μs/min)
Amount of time spent executing SQL statements.
Metric key: builtin:tech.oracleDb.cd.queries.sqlExec -
PL/SQL execution (μs/min)
Amount of time spent running the PL/SQL interpreter.
Metric key: builtin:tech.oracleDb.cd.queries.plSqlExec -
Connection management (μs/min)
Amount of time spent performing session connect and disconnect calls.
Metric key: builtin:tech.oracleDb.cd.queries.connMgmt -
Other (μs/min)
Amount of time spent performing all other activities.
Metric key: builtin:tech.oracleDb.cd.queries.other
¶ PGA memory
Metrics concerning Program Global Area (PGA) memory.
¶ Example charts
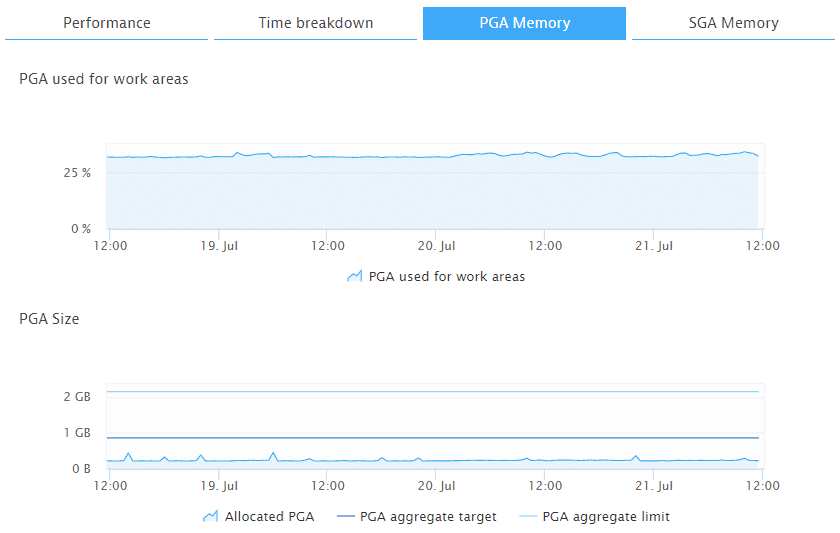
¶ PGA used for work areas
- PGA used for work areas (%)
Amount of allocated PGA memory that is currently consumed by work areas. It can be used to determine how much memory is consumed by other consumers of PGA memory (for example, PL/SQL or Java).
Metric key: builtin:tech.oracleDb.cd.memory.pga.usedForWorkAreas
¶ PGA size
- Allocated PGA (B)
Current amount of PGA memory allocated by the instance. The Oracle Database attempts to keep this number below the value of the PGA aggregate target initialization parameter (see below). However, it is possible for the PGA allocated to exceed the target value by a small percentage and for a short period of time when the work area workload is increasing very rapidly or when the target value is low.
Metric key: builtin:tech.oracleDb.cd.memory.pga.size.allocated - PGA aggregate target (B)
The target aggregate PGA memory available to all server processes attached to the instance.
Metric key: builtin:tech.oracleDb.cd.memory.pga.size.pgaAggregateTarget - PGA aggregate limit (B)
A limit on the aggregate PGA memory consumed by the instance.
Metric key: builtin:tech.oracleDb.cd.memory.pga.size.pgaAggregateLimit
¶ SGA memory
Metrics concerning System Global Area (SGA) memory.
¶ Example charts
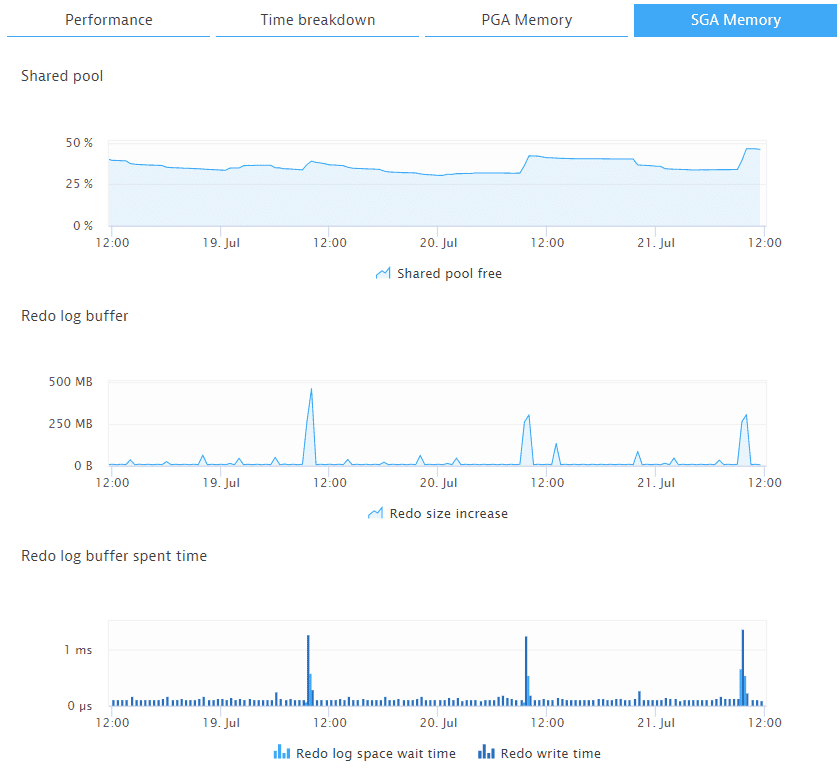
¶ Shared pool
- Shared pool free (%)
Amount of free system global area (SGA) memory available in shared pool.
Metric key: builtin:tech.oracleDb.cd.memory.sga.cacheBuffer.sharedPoolFree
¶ Redo log buffer
- Redo size increase (B/min)
Total amount of redo generated in bytes.
Metric key: builtin:tech.oracleDb.cd.memory.sga.redoBuffer.redoSizeIncrease
¶ Redo log buffer spent time
- Redo log space wait time (μs/min)
Total elapsed time of waiting for redo log space request.
Metric key: builtin:tech.oracleDb.cd.memory.sga.redoBuffer.redoLogSpaceWaitTime - Redo write time (μs/min)
Total elapsed time of the write from the redo log buffer to the current redo log file.
Metric key: builtin:tech.oracleDb.cd.memory.sga.redoBuffer.redoWriteTime
¶ Most time consuming Oracle statements
Metrics concerning statements that take the most time to execute.
To view charts of these metrics per Oracle statement, click View statements in the Most time consuming Oracle statements section, and then click Details for a statement.
¶ Statements performance
¶ Example chart
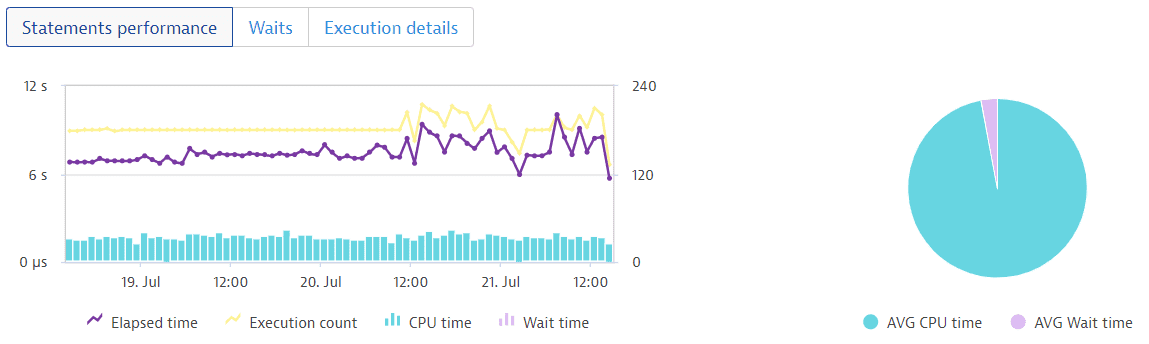
- Elapsed time (μs)
Amount of time during query execution spent for parsing, executing, and fetching.
Metric key: builtin:tech.oracleDb.cd.slow.time.elapsed - Execution count (count)
Total number of executions totalled over all the child cursors of the query.
Metric key: builtin:tech.oracleDb.cd.slow.executions - CPU time (μs)
Amount of CPU time during query execution spent for parsing, executing, and fetching.
Metric key: builtin:tech.oracleDb.cd.slow.time.cpu - Wait time (μs)
Total amount of time waited for an event.
Metric key: builtin:tech.oracleDb.cd.wait.time
¶ Waits
¶ Example chart
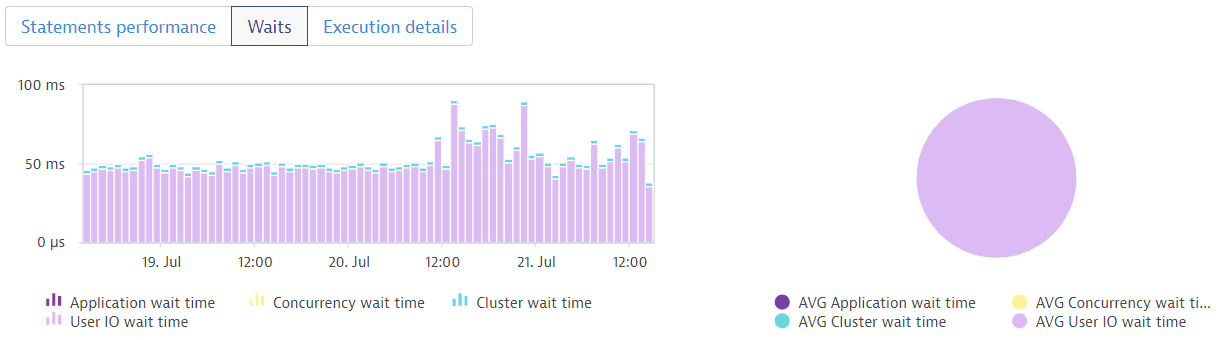
- Application wait time (μs)
Amount of elapsed time during query execution spent in application wait class.
Metric key: builtin:tech.oracleDb.cd.slow.time.application - Concurrency wait time (μs)
Amount of elapsed time during query execution spent in concurrency wait class.
Metric key: builtin:tech.oracleDb.cd.slow.time.concurrency - Cluster wait time (μs)
Amount of elapsed time during query execution spent in cluster wait class.
Metric key: builtin:tech.oracleDb.cd.slow.time.cluster - User IO wait time (μs)
Amount of elapsed time during query execution spent in user I/O wait class.
Metric key: builtin:tech.oracleDb.cd.slow.time.userIo
¶ Execution details
¶ Example chart
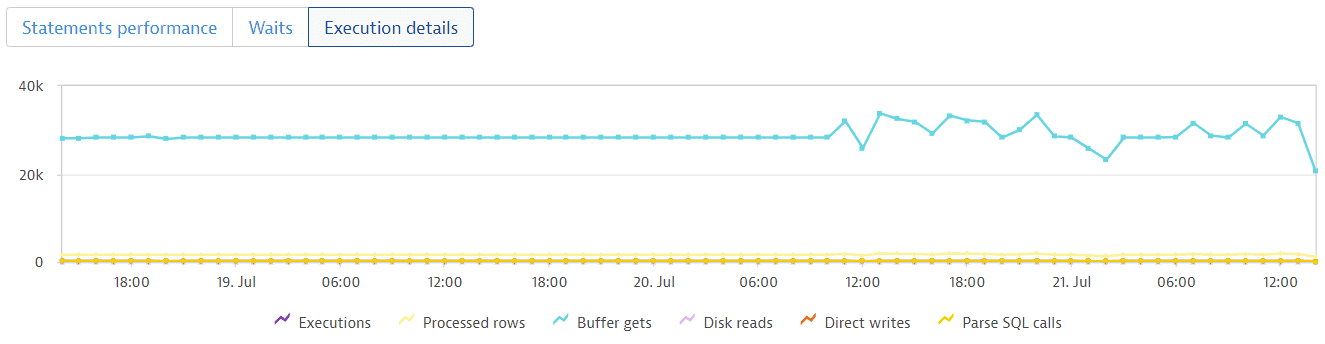
- All sessions (count)
Total number of all sessions regardless of their state and wait class.
Metric key: builtin:tech.oracleDb.cd.sessions.all - Executions (count)
Total number of executions totalled over all the child cursors of the query.
Metric key: builtin:tech.oracleDb.cd.slow.executions - Processed rows (count)
Total number of rows processed by the query.
Metric key: builtin:tech.oracleDb.cd.slow.rowsProcessed - Buffer gets (count)
Sum of buffer gets over all child cursors of the query.
Metric key: builtin:tech.oracleDb.cd.slow.bufferGets - Disk reads (count)
Sum of the number of disk reads over all child cursors of the query.
Metric key: builtin:tech.oracleDb.cd.slow.diskReads - Direct writes (count)
Sum of the number of direct writes over all child cursors of the query.
Metric key: builtin:tech.oracleDb.cd.slow.directWrites - Parse SQL calls (count)
Sum of all parse calls to all the child cursors of the query.
Metric key: builtin:tech.oracleDb.cd.slow.parseCalls - Number of wait events (count)
Total number of waits for an event.
Metric key: builtin:tech.oracleDb.cd.wait.count
¶ Frequently asked questions
¶ Do I need a plugin to use Oracle database insights?
No, database insights is a default DESK feature starting with version 1.173.
¶ What is the license model?
The current Early Adopter release of database insights is free, available with every ActiveGate and DESK server version 1.173+. In the future, the price will be based on the number of consumed metrics.
¶ Can I use a Cluster ActiveGate for Oracle database insights?
No. You can only use an Environment ActiveGate that remotely connects to your Oracle server and fetches metrics and properties every minute. As Environment ActiveGate is installed in your local environment, this strengthens the security and minimizes the traffic load in your network. Note that the main purpose of the Cluster ActiveGate is OneAgent traffic routing.
¶ Do I need to install OneAgent on the Oracle host?
No, but we recommend it, because doing so gives you a better overall picture of your database, the server, and all the processes running on it, and even log monitoring. This way you’ll be able to react to potential issues quicker, and you'll have a better understanding of the root cause.